
Metapopulation Dynamics - Levins Model
Procedure
- The simulator enables users to investigate the dynamics of patch occupancy in a metapopulation using the Levins model. Users can configure the model parameters governing colonization and extinction, execute the simulation, visualize changes in occupied habitat patches over time, and analyse the effects of different ecological conditions on metapopulation persistence.
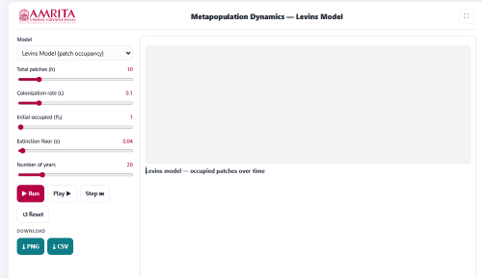
- The simulator consists of a parameter panel on the left and a visualization panel on the right for displaying the simulation and the corresponding graph.
- Select the metapopulation model from the Model drop-down menu. Choose the Levins Model (Patch Occupancy) to simulate metapopulation dynamics based on habitat patch occupancy.
- Specify the total number of habitat patches (h) using the corresponding slider. This parameter defines the total number of habitats patches available for colonization within the simulated landscape.
- Adjust the colonization rate (c) using the corresponding slider. The colonization rate determines the probability that unoccupied habitat patches become colonized by individuals dispersing from occupied patches.
- Specify the initial occupied proportion using the Initial occupied (P₀) slider. This parameter defines the initial fraction of habitat patches occupied at the beginning of the simulation.
- Set the extinction rate using the Extinction floor (e) slider. This parameter determines the probability of local extinction within occupied habitat patches during the simulation.
- Specify the duration of the simulation using the Number of years slider. This parameter determines the total number of time steps over which the metapopulation dynamics are simulated.
- After configuring all simulation parameters, click the Run button to execute the simulation. The simulator calculates the changes in occupied habitat patches over the specified simulation period.
- Alternatively, click the Play button to visualize the simulation continuously or click the Step button to advance the simulation one time step at a time for detailed observation of the metapopulation dynamics.
- Observe the habitat patch visualization displayed in the upper panel. Each square represents an individual habitat patch within the simulated landscape. The occupancy status of each patch is updated throughout the simulation to illustrate the colonization and persistence of the metapopulation.
- Examine the occupancy summary displayed below the habitat grid. This section indicates the number of occupied patches relative to the total number of habitat patches available in the simulation.
- Observe the Levins model graph displayed beneath the habitat grid. The graph illustrates the variation in the number of occupied habitat patches (P) throughout the simulation period.
- Interpret the graph by examining its axes. The X-axis (Number of years) represents the simulation time, whereas the Y-axis (Occupied Patches, P) represents the number of habitat patches occupied by the metapopulation at each time step.
- Observe the trend of the occupancy curve to determine how the number of occupied habitat patches changes over time. Compare the initial occupancy with the occupancy observed during the later stages of the simulation.
- Identify whether the occupancy curve approaches a stable value. A stable plateau indicates that the metapopulation has reached an equilibrium between colonization and local extinction under the selected simulation parameters.
- Read the simulation message displayed below the graph, which summarizes the ecological outcome of the simulation, such as whether the equilibrium occupancy has been achieved based on the relationship between colonization and extinction rates.
- If required, click the Play button to replay the simulation continuously or click the Step button to advance the simulation one year at a time for detailed observation of changes in habitat occupancy.
- Modify one or more model parameters, including the colonization rate (c), extinction rate (e), initial occupied patches (P₀), or total number of habitat patches (h), and execute the simulation again to examine their influence on metapopulation persistence and equilibrium occupancy.
- Click the Reset button, if required, to restore the default simulation parameters before initiating another simulation.
- Download the simulation results by clicking the PNG button to save the graphical output or the CSV button to export the numerical simulation data for further analysis.
- Repeat the above procedure using different combinations of colonization rates, extinction rates, initial occupancy levels, and habitat patch numbers to investigate their influence on metapopulation dynamics, equilibrium occupancy, and extinction risk.